Designing a Financial Control Tower for Real-Time Decision Making
Transforming fragmented financial data into a unified, AI-powered analytics experience for C10 Global.
Role
Senior UX Designer
Duration
6 months
Tools
Figma, Power BI
Domain
Financial Analytics / Enterprise UX
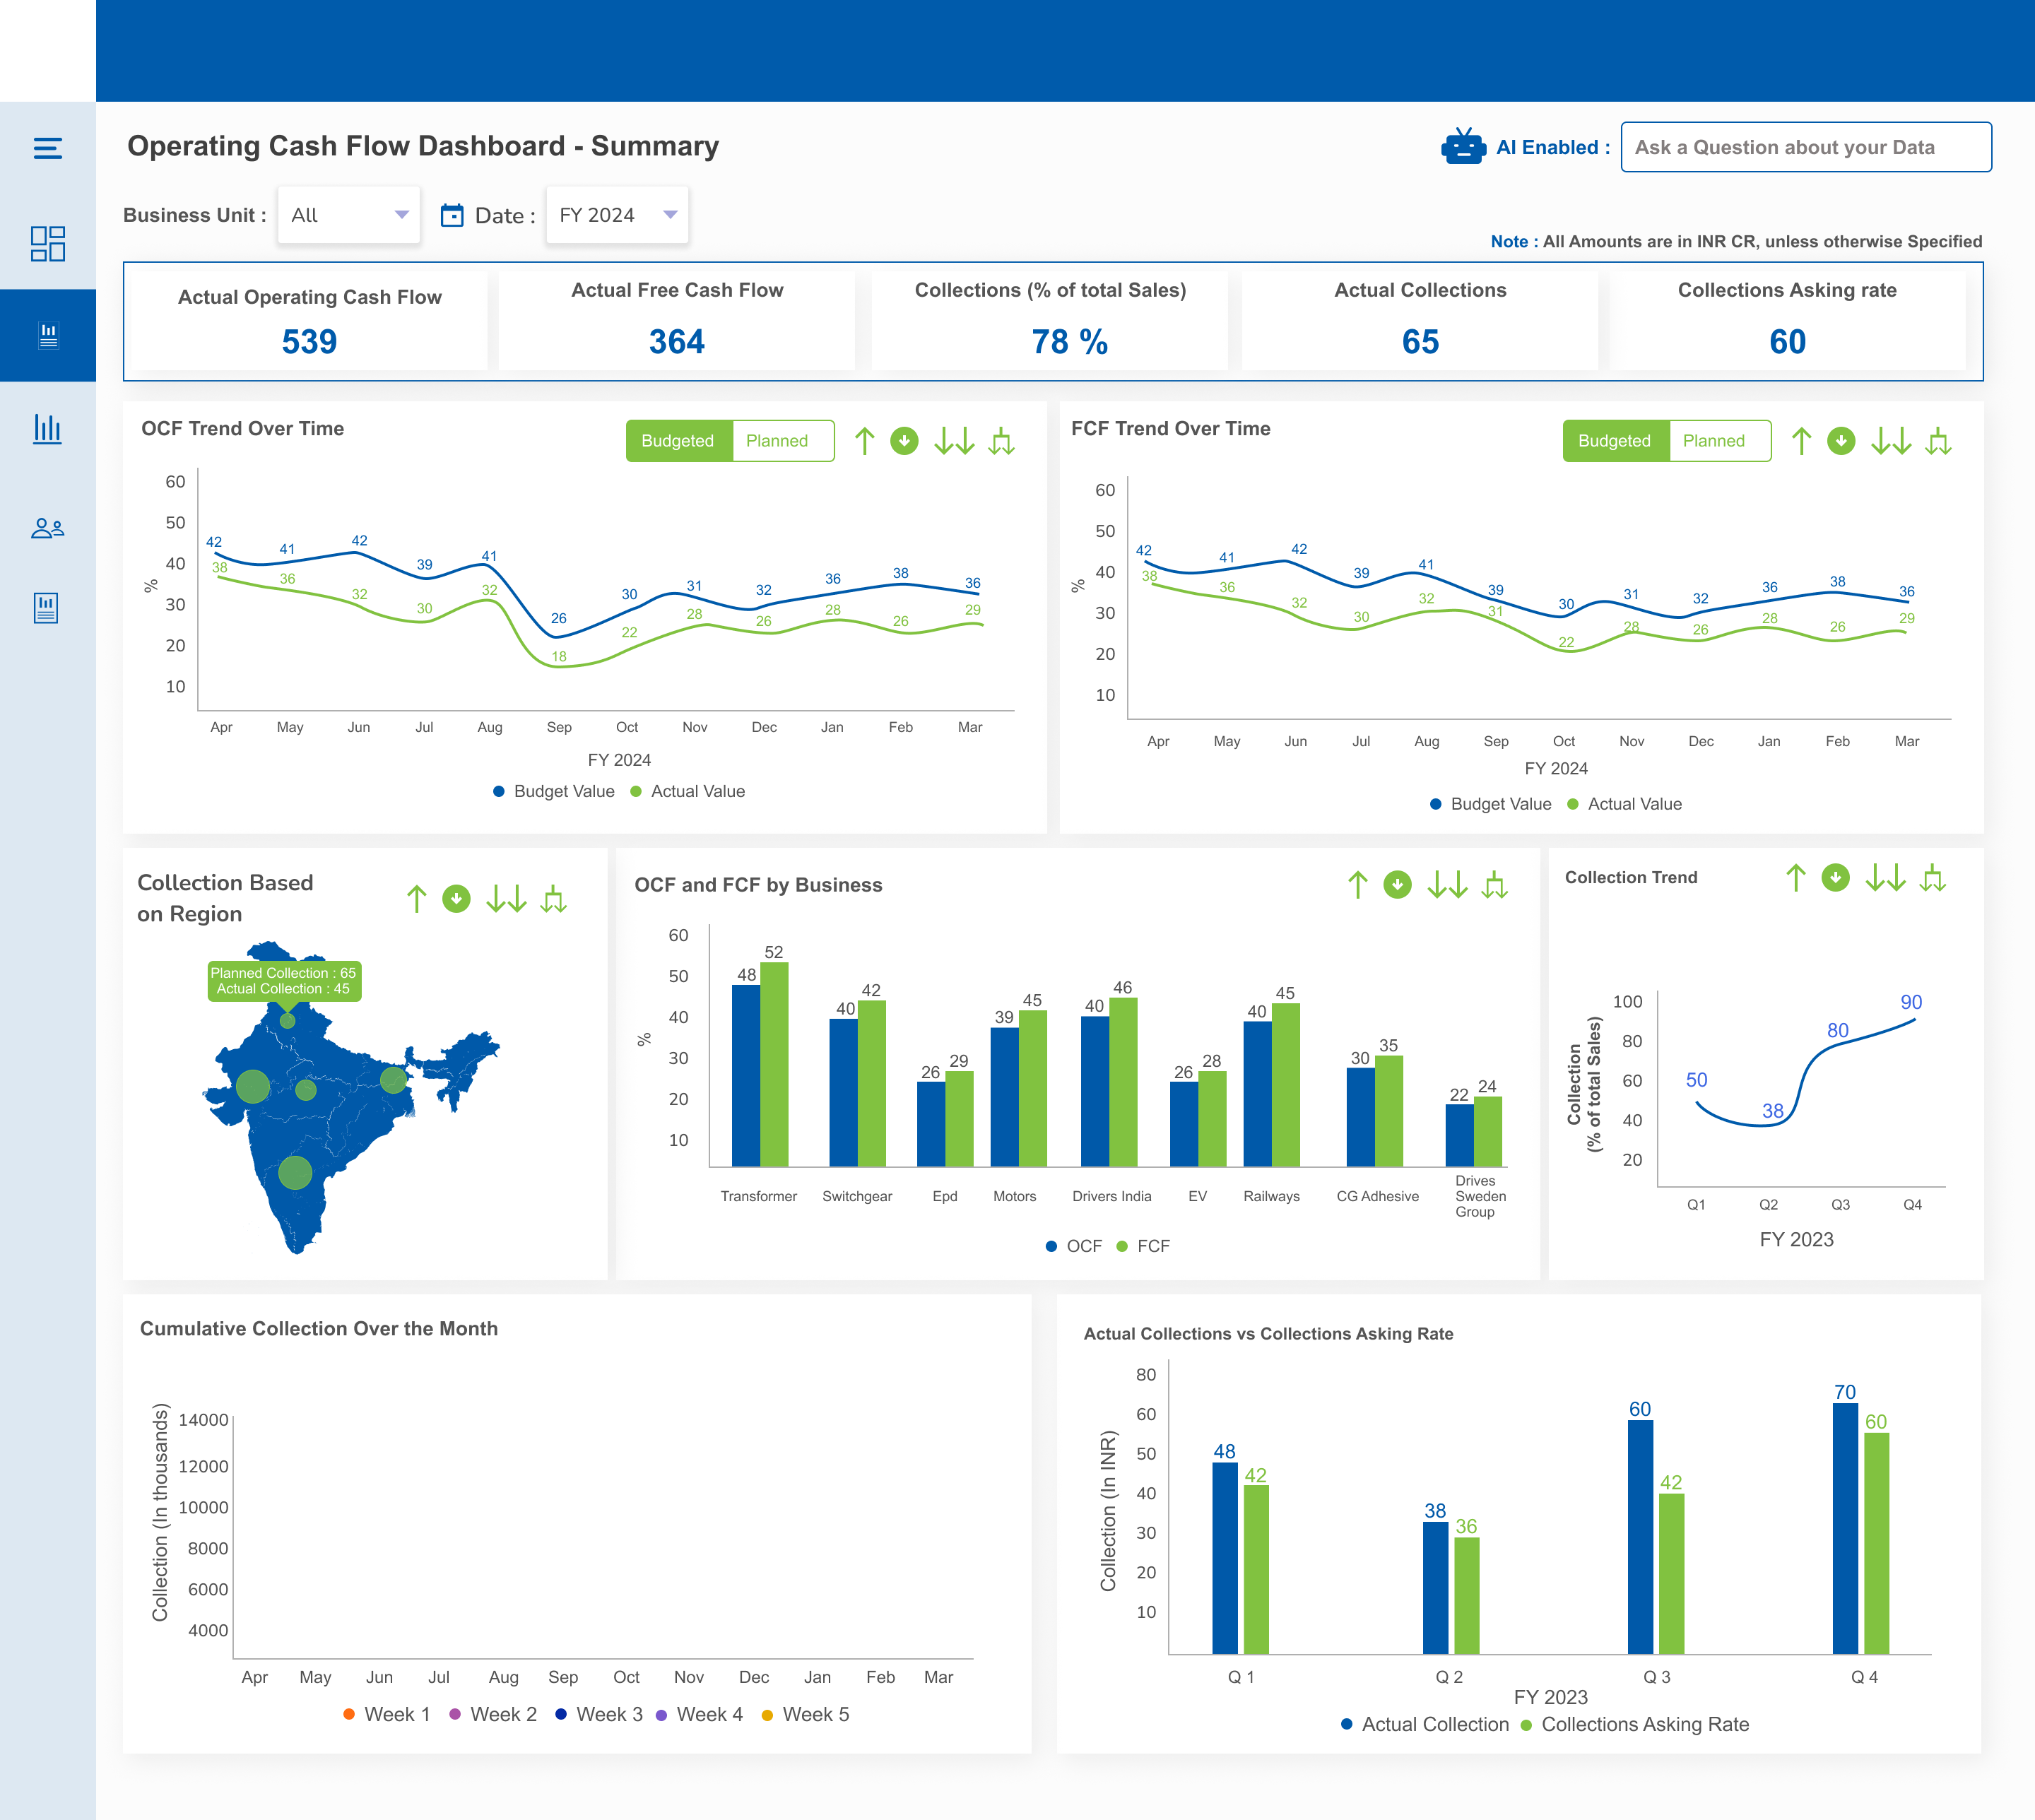
Dashboard Screens
What We Aimed to Achieve
Create a single source of truth for financial decision-making
Unify financial KPIs
Bring all metrics into one view
Enable real-time monitoring
Live data updates for instant awareness
Reduce cognitive load
Simplify complex information
Support faster decisions
Empower executives with clarity
Designing for Clarity, Speed, and Scale
Understand Users
- →Leadership interviews
- →Identify decision bottlenecks
Structure Information
- →Define KPI hierarchy
- →Map dashboard architecture
Design Experience
- →Wireframes → Visual design
- →Data visualization strategy
Validate & Iterate
- →Feedback loops
- →Improve usability
A Unified Financial Control Tower
Unified KPI Layer
- Operating Cash Flow
- Free Cash Flow
- Collections
→ Instant executive overview
Advanced Visualizations
- Budget vs Actual trends
- Business unit comparisons
- Regional performance maps
→ Faster pattern recognition
Layered Insights
- Drill-down by business, region, time
- High-level → detailed views
→ Flexible decision depth
AI-Assisted Insights
- "Ask AI" for quick queries
- Automated insight discovery
→ From dashboards → conversations
Key UX Decisions
What Made the Experience Work
Designed top-down hierarchy for executives
Applied progressive disclosure
Standardized chart patterns
Focused on data storytelling, not just visuals
Measured Business Outcomes
30%
Faster Insights
Time-to-insight significantly reduced
20%
Better Decision Efficiency
Improved clarity and confidence
25%
Less Analysis Time
Reduced manual effort
From Insight-Poor to Data-Rich
A large enterprise the C10 Global had access to vast financial data — but lacked clarity.
Before
- Fragmented systems
- Static reports
- Manual analysis
After
- Unified dashboard
- Real-time insights
- AI-assisted decisions
Before vs After
| Before | After |
|---|---|
| Fragmented data | Unified control tower |
| Static dashboards | Interactive insights |
| Manual interpretation | AI-assisted decisions |
| Slow decisions | Real-time clarity |
What This Project Taught Me
Simplicity is critical in
data-heavy systems
Dashboards should enable
decisions, not just display data
Layered UX is key for
enterprise complexity
AI should feel
assistive, not overwhelming
Designing for Decision-Making at Scale
This project demonstrates how UX can transform enterprise analytics from data overload → decision intelligence.